Description: No description available.
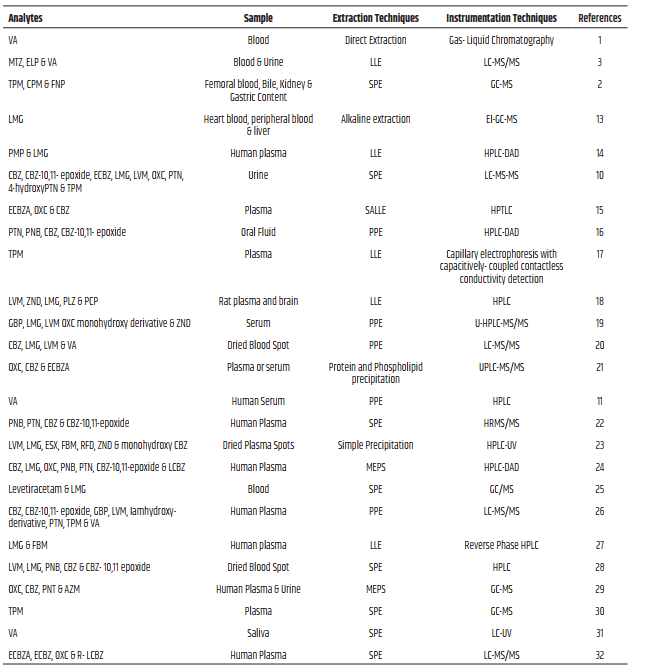
Description: Table 1: Developed methods and techniques for extraction and quantification of selected ACDs from different biological matrices
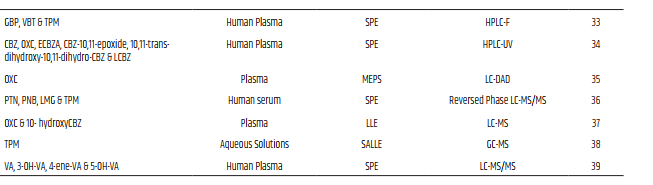
Description: Table 2: Chemical Composition for synthesis of simulated urine
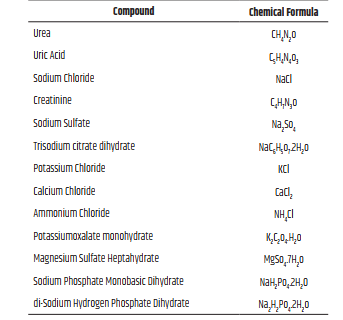
Description: Table 3: Gradient of Mobile Phase A and B for chromatographic analysis
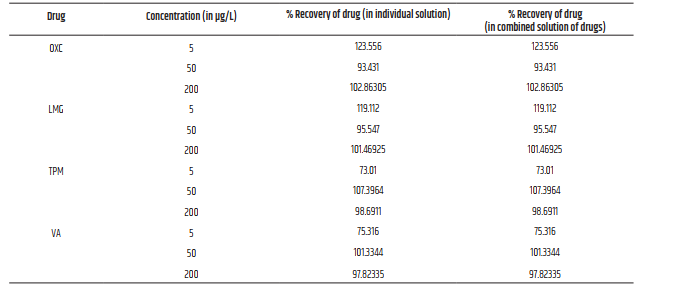
Description: Table 4: Impact of Interference on recovery of individual drugs
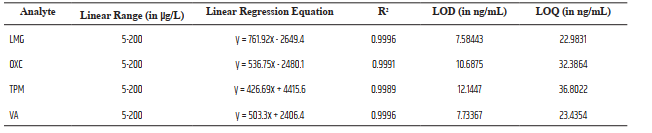
Description: Table 5: Linear Range, Linear Regression Equation, R2, LOD, LOQ values for selected ACDs
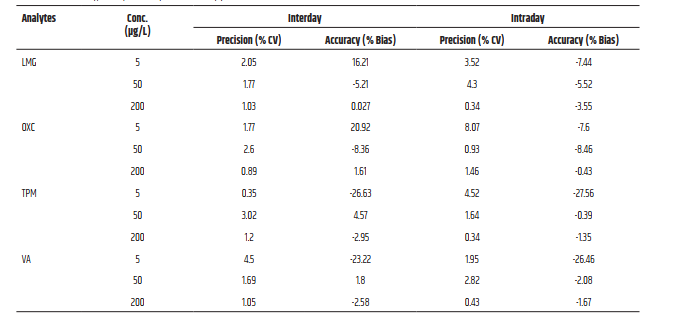
Description: Table 6: Recovery, RSD%, Interday and intraday precision for selected ACDs
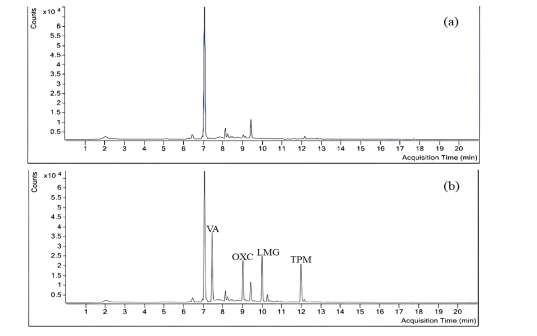
Description: Fig. 1: Chromatogram of (a) Blank Matrix sample, (b) Spiked matrix with selected ACDs at 100 ppb
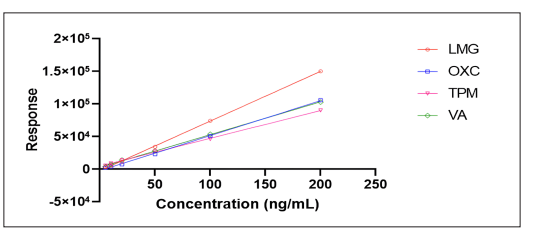
Description: Fig. 2: Calibration curve of all the 4 drugs
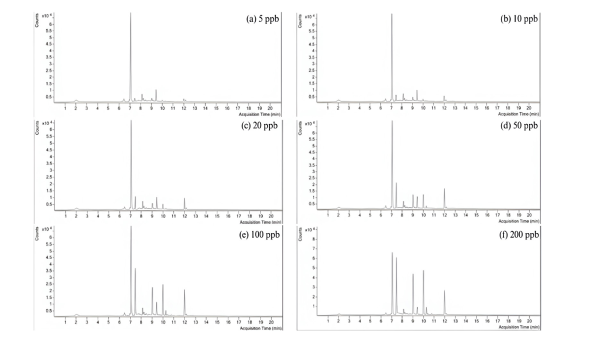
Description: Fig. 3: LC-MS/MS Chromatogram for LMG, OXC, VA and TPM at concentrations (a) 5 ppb, (b) 10 ppb, (c) 20 ppb, (d) 50 ppb, (e) 100 ppb and (f) 200 ppb in biological matrix
Full-Size
Email
+ Favorites
Export
View in Gallery