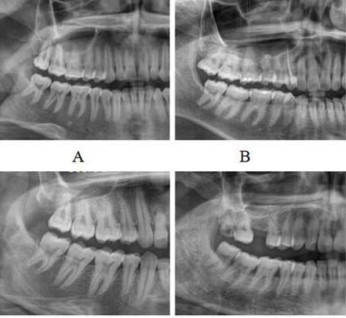
Description: The radiographic visibility in lower third molars is displayed by the OPG as follows: (A) Stage 0 (B) Stage 1 (C) Stage 2 (D) Stage 3.
Heading
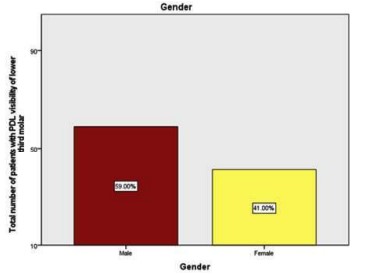
Description: The gender distribution is shown in a bar graph. Males are indicated by red, and females by yellow. Males (59%) made up the majority of the patients reported for the study, compared to females (41%).