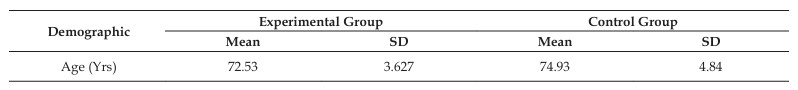
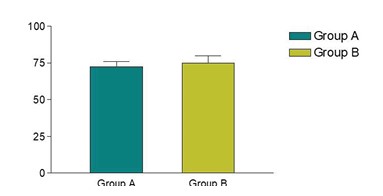
Depicts the age difference between the Group A and Group B
Description: No description available.
Shows mean ages: Group A 72.53, Group B 74.93, with a 2.4 difference
Description: No description available.
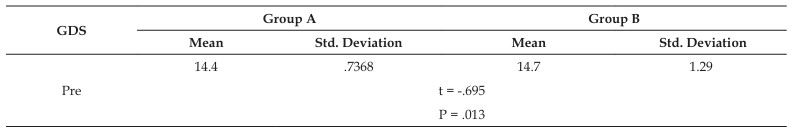
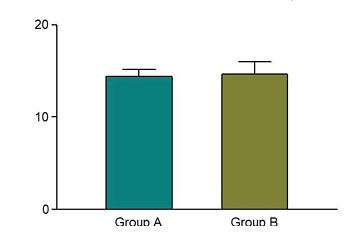
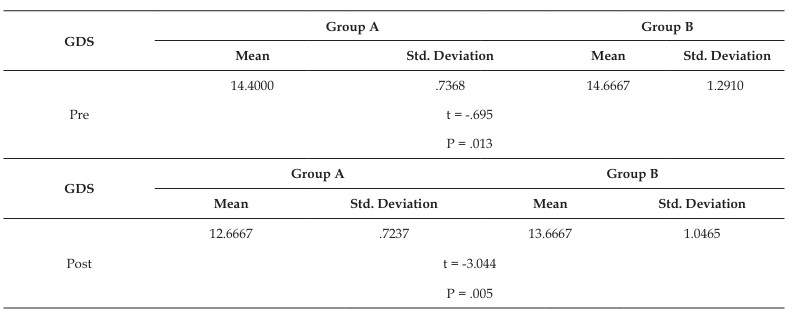
Shows intergroup comparison of mean and standard deviation of Pre GDS Score of both the Group A and Group B
Description: No description available.
Shows pre-GDS scores: Group A 14.4, Group B 14.7
Description: No description available.
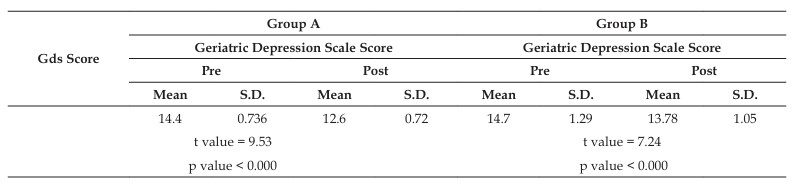
Shows highly significant pre-post GDS score improvements for Group A (t=9.53) and Group B (t=7.24, p<0.0001). Paired t-test: Intragroup comparison of Pre-Post GDS of Group A
Description: No description available.
Heading
Description: No description available.
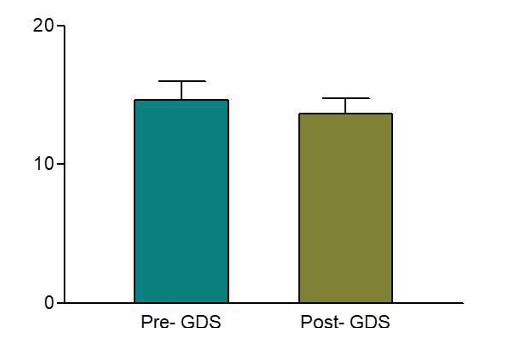
Depicts improvement in mean difference of pre and post GDS score of subjects of Group A. The pre and post GDS score of Group A is 14.4 and 12.6 respectively
Description: No description available.
Shows Group B’s GDS improvement: 14.7 to 13.78
Description: No description available.
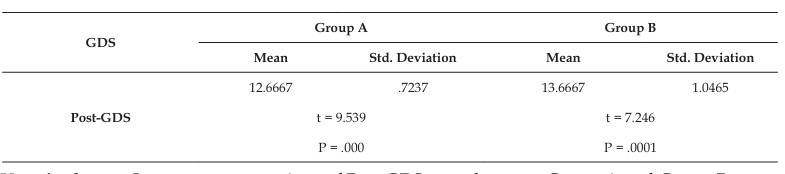
Depicts the difference of Pre and Post GDS score of Group A and Group B
Description: No description available.
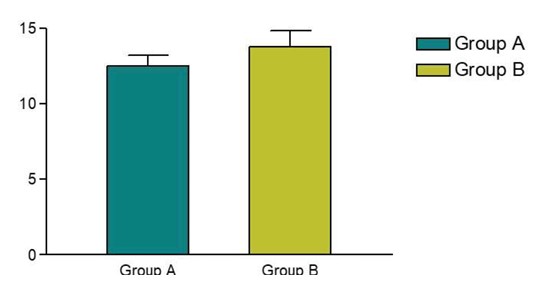
Depicts the mean and standard deviation of post Intervention (Post-GDS) training scores of Group A and Group B
Description: No description available.
Shows a mean difference of 1.18 between Post GDS Scores of Group A and B
Description: No description available.
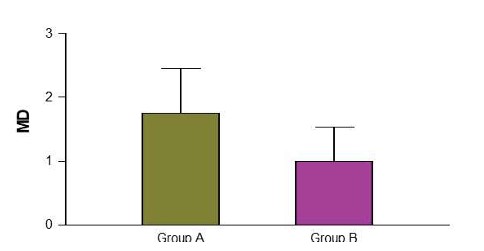
Shows mean difference between Pre Post GDS Value of both the Group A and Group B
Description: No description available.
Shows mean difference between Pre Post GDS Value of both the Group A and Group B
Description: No description available.
Shows GDS improvement: Group A 1.8, Group B 0.92, highlighting Group A’s greater change