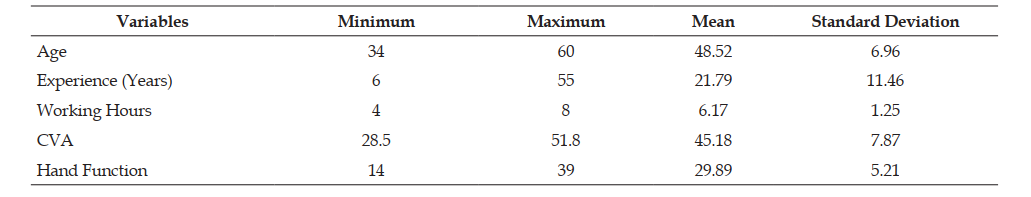
Description: Table 1 shows the mean and standard deviation values of various parameters were calculated as age [48.52 ± 6.96], experience [21.79 ± 11.46], CVA [45.18 ± 7.87], Hand Function [29.89 ± 5.21].
Heading
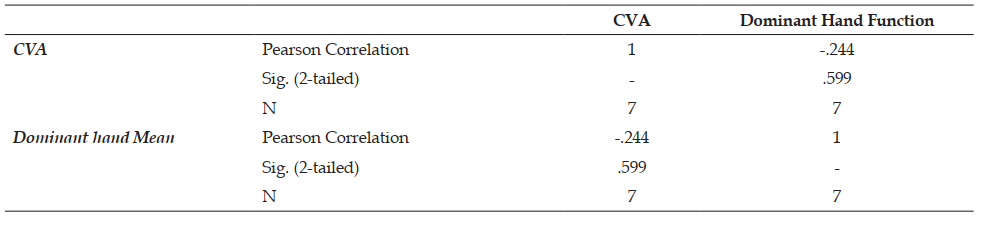
Description: Table 2 Pearson correlation was conducted to explore the relationship between CVA and Dominant Hand Function. Results showed a weak negative correlation (r = -0.244, p = 0.599), which was not statistically significant. This indicates that there is no significant linear association between CVA and Dominant hand Mean in the Skilled Tailors.
Heading
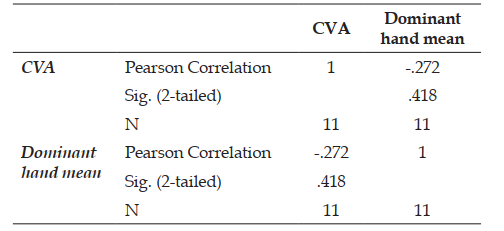
Description: Table 3 A Pearson correlation analysis was conducted to examine the relationship between CVA and Dominant hand mean in the sample (N = 11). The analysis revealed a weak negative correlation (r = -0.272, p = 0.418), which was not statistically significant. This indicates that there is no significant linear association between CVA and Dominant hand mean in the current sample.
Heading
Description: Table 4 A Pearson correlation analysis was conducted to examine the relationship between CVA and Dominant hand mean in the ‘26 and above’ group. The results revealed a weak positive correlation (r = 0.279, p = 0.467), which was not statistically significant. This indicates that there is no significant linear association between CVA and Dominant hand mean in this sample (N = 9).