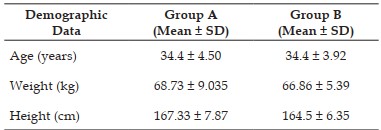
Description: Demographic table
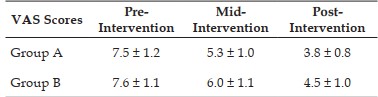
Description: VAS table shows pain levels across the intervention period
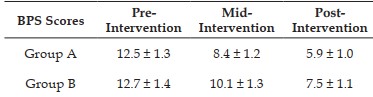
Description: The BPS table highlights improvements in mobility
Full-Size
Email
+ Favorites
Export
View in Gallery