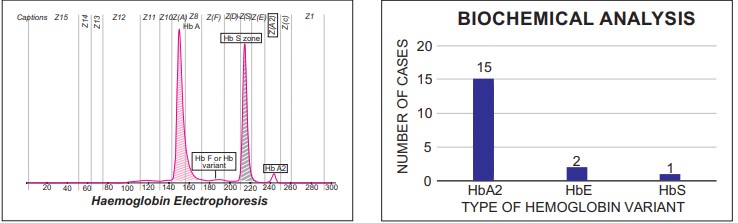
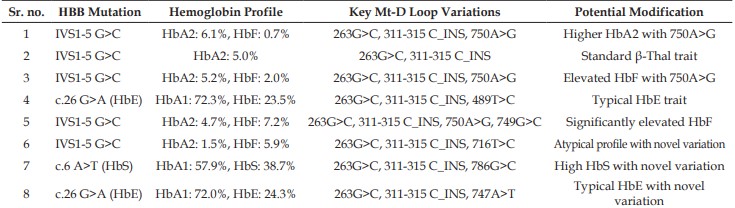
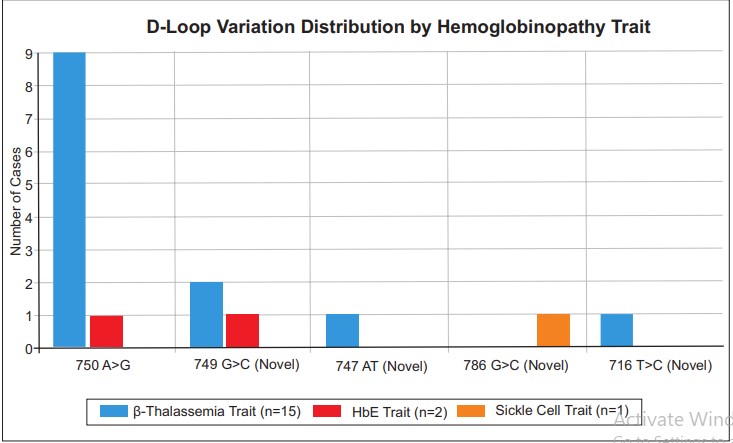
Description: Figure 1: (a) Representing the electropherogram for Sickle Cell Trait as an elevated Sickle cell Hemoglobin (HbS) level; (b) Data representation of the number of cases and types of hemoglobinopathy
Heading
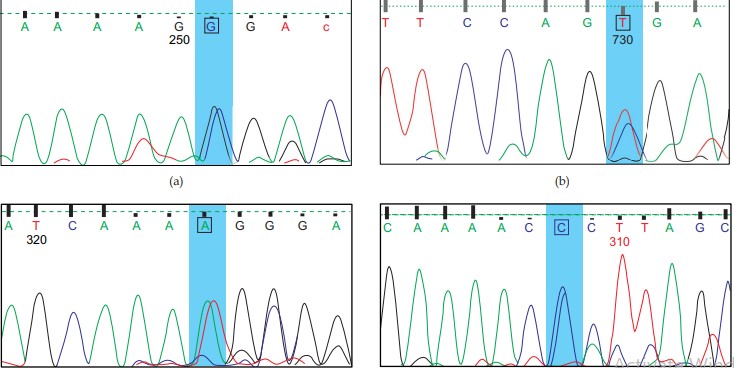
Description: Figure 2: Novel Heteroplasmy Variation Reported in Mitochondrial D-Loop at MT-RNR1 Region. (a) G749C, (b) T716C, (c) A747T, and (d) G786C