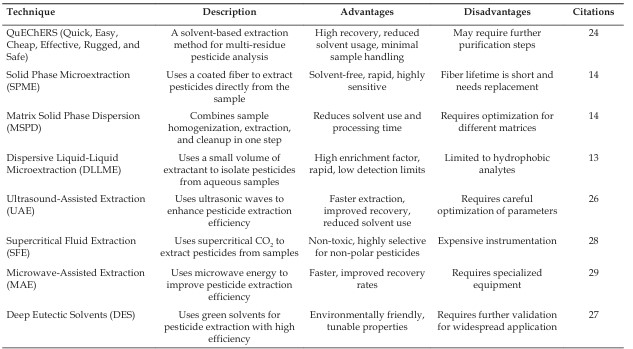
Different analytical techniques used for hair pesticide long-term monitoring, along with their advantages and disadvantages
Description: No description available.
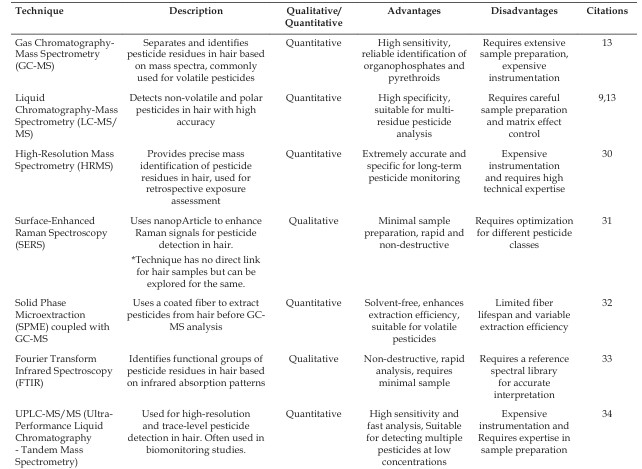
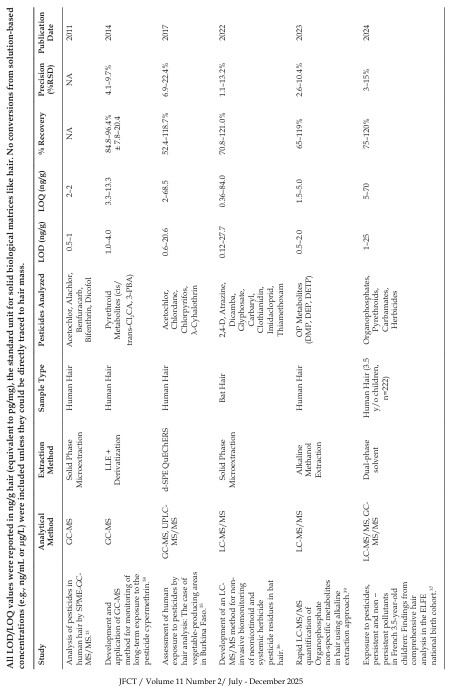
Key studies on pesticide biomonitoring using hair as a matrix.
Description: No description available.
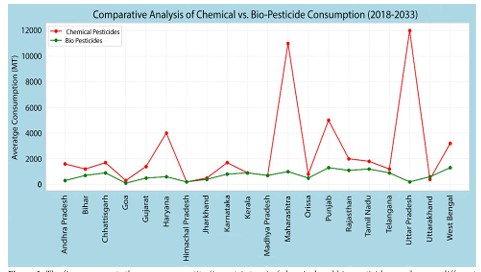
The figure presents the average quantity of chemical and bio-pesticides used across different Indian states between 2018 and 2023. The red line represents chemical pesticide usage, while the green line represents bio-pesticide usage
Description: No description available.
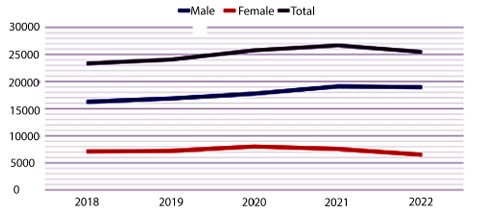
The graph illustrates the trend in suicides due to insecticide consumption from 2018 to 2022, categorized by gender
Description: No description available.
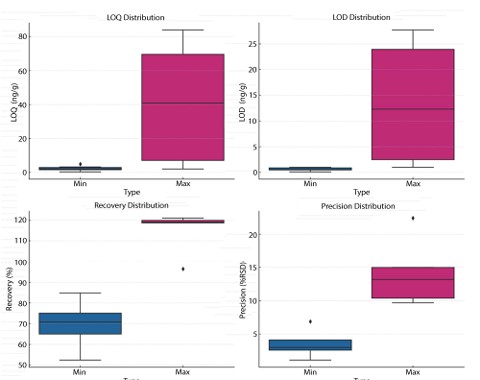
Boxplot Representation of LOQ, LOD, Recovery, and Precision Distributions